


A description of the UI (User Interface) and its features.
Overview
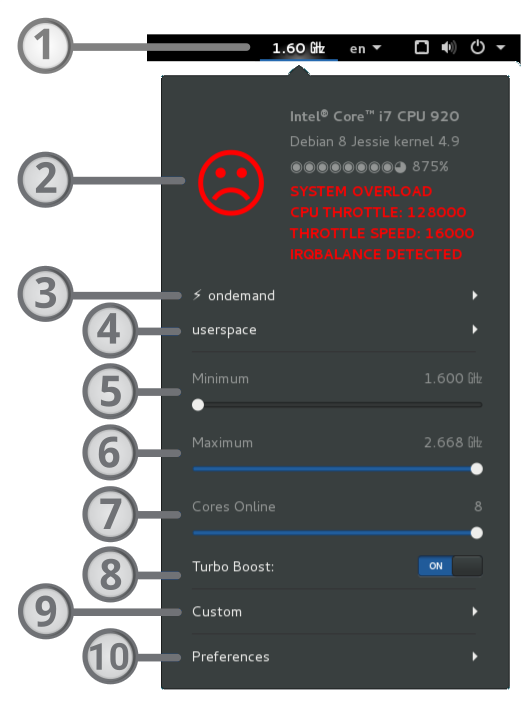
UI Elements
- Frequency Indicator
- Info Panel
- CPU Governors Section
- Userspace Governor Section
- Minimal Frequency Slider
- Maximum Frequency Slider
- CPU Core Threads Slider
- CPU Turbo Mode Switcher
- User Profiles Section
- Preferences Section
1. Frequency Indicator
The Frequency Indicator shows the current maximum CPU frequency on the active CPU core thread. It helps to visualize your setting’s modifications and to monitor the system activity. It can be useful to detect abnormal activities on the system when it should be idle.
The default frequency monitoring interval can be changed in the Preferences window.
IMPORTANT: frequency monitoring doesn’t require a lot of system resources but you shouldn’t go for very low values. It’s milliseconds (1000 times per second). Otherwise, your system could be busy with the monitoring only or even have bugs. I recommend you to open the system monitor and check the cpufreq-service process when you are changing the settings to see the service loading usage. You can check the system journal (sudo journalctl -f) for messages reporting failures.
2. Info Panel
System Status

- ☺ ALL OK the extension do not detect any (supported) issues on your system.
- 😐 WARNING the extension detected some minor issues like IRQBALANCE DETECTED or SYSTEM BUSY messages.
- ☹ CRITICAL the extension found some critical issues like SYSTEM OVERLOAD, CPU THROTTLE, THROTTLE SPEED messages.
See more about System Status Messages
CPU Model Name
Shows the CPU Model Name.
OS Release information
Shows the Linux Distribution Name and the short major kernel version.
Loading Indicator
Shows a percentage of the system load from for the last minute’s activity and its symbolic representation. Each full circle represents 100% of the core load.
See more here: What is CPU loading in Linux?
System Status Messages
Focus your attention to some potential issues on your system among the following:
- CPU LOAD issues (See the Loading Indicator section…)
- THERMAL THROTTLING issues Two message types:
- CPU THROTTLING means your CPU hit a critical temperature and some core threads went off for the COUNT OF MISSED CPU CYCLES.
- THROTTLING SPEED means your CPU is hitting critical temperature right now and shows NUMBER MISSING CPU CYCLES per second. See more about thermal throttling?
- IRQBALANCE DETECTED irqbalance package can affect the system stability and power usage. It’s important, especially, for mobile devices in the first place but it affects all devices and can reduce the battery life or system devices lifetime. See more about IRQBALANCE DETECTED
- Governors You can see governors information if you set up a mixed mode where different CPU core are assigned to different active governors. See more about mixed mode
3. CPU Governors Section
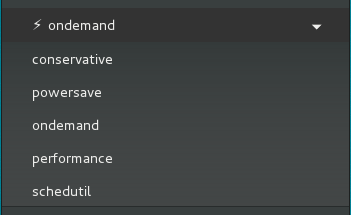
Here you can select the available CPU governor. The governors allow to manage the CPU in different ways. Also, their names are generally explicit like powersave is for power saving etc. You can have a different number of available governors as it depends on the current ACPI mode and loaded kernel modules.
The section’s header (submenu) shows the active governor. Also, it can show Mixed mode when core threads have different governors. The child menu items represent system governors.
See more about CPU governors
4. Userspace Governor Section
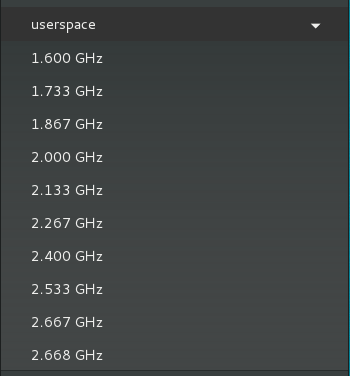 Userspace Governor is only available with the kernel acpi-cpufreq driver.
Userspace Governor allows you to set one of the available CPU Frequencies when cores have a constant frequency and a minimal core frequency equal to the maximum frequency. It can be used to test an application performance scaling for example.
See more about CPU governors
5. Minimal Frequency Slider
Each processor core (thread) can have a minimal allowed frequency value and core frequencies can’t go lower. It can be used to increase the overall system reactivity as processor cores can’t go too low and instead are ready to work on higher frequencies right away.
6. Maximum Frequency Slider
Each processor core (thread) can have maximum allowed frequency value and core frequencies can’t go higher. It can be used to reduce the system power consumption when processor cores can’t go too high.
7. CPU Core Threads Slider
First, you have to disable/remove IRQBALANCE package for the system stability!
This feature is only available for multi-core processors.
Allows you to turn off or on processor cores through the Linux kernel. It can be used to reduce the power consumption or for testing purposes like application scaling analyses.
8. CPU Turbo Mode Switcher
This feature is only available for the supported processor models.
Allows you to turn off or on the processor boost feature through the Linux kernel. The processor boost feature allows CPU to go higher than standard frequencies for a limited time only. It dramatically increases processor power consumption and heating.
It's usually a good idea to turn it off for laptops. Usually, laptop cooling system is weak and can easily get hot. If you want to increase the system responsiveness on a laptop you can just increase the minimal frequency slider.
9. User Profiles Section
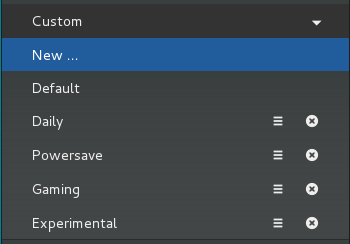
User profiles allow the creation of custom power profiles to quickly switch between various application settings. The profiles header shows the current profile. The profile manager has two items by default. First, it’s the New… item creating a new profile from current settings. You just have to give it a name and press Enter to confirm the creation. Second, it’s the default profile automatically created when the application is loading.
After creating a custom user profile you can switch to the saved settings (profile) anytime by clicking on the profile name.
You can delete any user profile just by clicking on its close button X.
Also, you can replace any profile with current setting and rename it by clicking on edit button. So just to change some settings, you have to load it, make some changes in the settings and click profile edit button to save current changes to it. You can rename the profile in the editing mode so.
10. Preferences Section
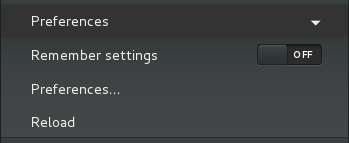
Here are general settings for the extension:
- Remember setting if changes will be automatically saved and restored on next start. The default value is off.
- Preferences… opens the preferences window with extra options.
- Reload restarting the extension without reloading Gnome Shell.
Preferences Window
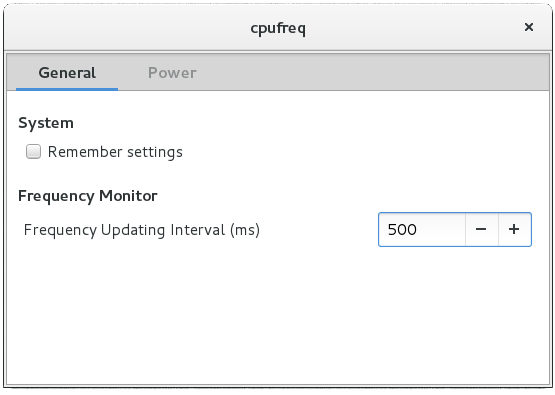
From here you can:
- Set Remember settings option.
- Set Frequency Updating interval option. It describes how often the application monitor will be checking for the current core frequencies. Default value is 500 milliseconds (it means 2 times per second). Don’t go to very low values! It could make extra system loading. So human eye cannot even notice this changes.
- Assign user profiles on charging and discharging battery events.